- Global Markets Investor
- Posts
- ⚠️The US private sector employment is in a recession
⚠️The US private sector employment is in a recession
US labor market trends are heading in the undesired direction
Global Markets Investor
July 08, 2025
In partnership with
The Bureau of Labor Statistics (BLS) estimates the US economy created 147,000 jobs in June, according to a report released July 3. This was above Wall Street’s expectations of 111,000.

Private payrolls rose by 74,000 jobs, the least since October 2024 and were driven by health care.
The unemployment rate fell to 4.1% from 4.2%, below the estimates of 4.3%. The unemployment rate for Black workers jumped to 6.8% in June, reaching its highest level in 4 years. Meanwhile, rates for adult women and White workers declined to 3.6% each. Jobless figures for adult men held steady at 3.9%, while Asian workers maintained a 3.5% rate. Hispanic unemployment showed little change at 4.8%, and teenage workers remained the highest at 14.4% with minimal monthly movement.

Stop Drowning in Market News. Focus On Making Money.

Every day: 847 financial headlines, 2,300 Reddit stock mentions, 156 Twitter trading threads, 12 IPO updates, 94 crypto developments.
Your problem isn't lack of information; you have too much.
While you're scanning headlines wondering what matters, profitable trades slip by. The signal gets buried in noise.
What if someone did the heavy lifting for you?
Stocks & Income reads everything:
Twitter traders
Reddit buzz
IPO announcements
Crypto insider takes
Crowdfunding opportunities
Market news
Then we send you only what can actually move your portfolio.
No fluff. No useless news. Just actionable stock insights in 5 minutes.
We track every source so you don't have to. You get the 3-5 opportunities worth your time, delivered daily.
Stop wasting time on useless “investing news” and start thinking critically about real opportunities in the stock market.
Stocks & Income is for informational purposes only and is not intended to be used as investment advice. Do your own research.
These are initial and imprecise estimates and are subject to subsequent revisions.
At first glance, this data suggests the job market is strong, and it was a hot report. However, the real picture is completely different.

Behind the paywall, you will find out the full analysis of the US labor market, including forward-looking indicators, job openings, and layoffs data.
FREE REPORT EXAMPLE UNDER THE FIRST LINK BELOW

Links to the previous months’ reports are below.


JOB NUMBERS WILL BE REVISED DOWN MASSIVELY
Before we analyze the June report an important highlight about job market data from 2024.
The US job numbers will likely be revised down by nearly 800,000 for the 9-month period ending December 2024. This comes as the Quarterly Census of Employment and Wages (QCEW) data covering 97% of US employers showed the economy added 607,000 jobs during this period or 57% lower than the initially reported 1.4 million in the monthly non-farm payroll (NFP) reports. In other words, there was an unprecedented 793,000 gap between NFP data and QCEW data.

This suggests non-farm payrolls may have been overstated by ~88,888 jobs per month during this period. More details will become available in August.
Such massive revisions come due to the Labor Department surveys existing businesses, so it may overlook new companies and take time to confirm if a business has closed or simply stopped responding. A 'birth-death' model adjusts for this, but it is not as accurate as we have seen.
Switching to June’s data, the government added 73,000 jobs, currently employing a record 23.7 million, and this is why the non-farm payroll headline beat average Wall Street estimates. However, on a non-seasonally adjusted basis, the government actually lost 318,000 jobs.

Overall, out of the 147,000 estimated new jobs, 138,600 came from state government (+47,000), local governments (+33,000), and health care and social assistance (+58,600). The rest of job market created just 8,000 jobs.

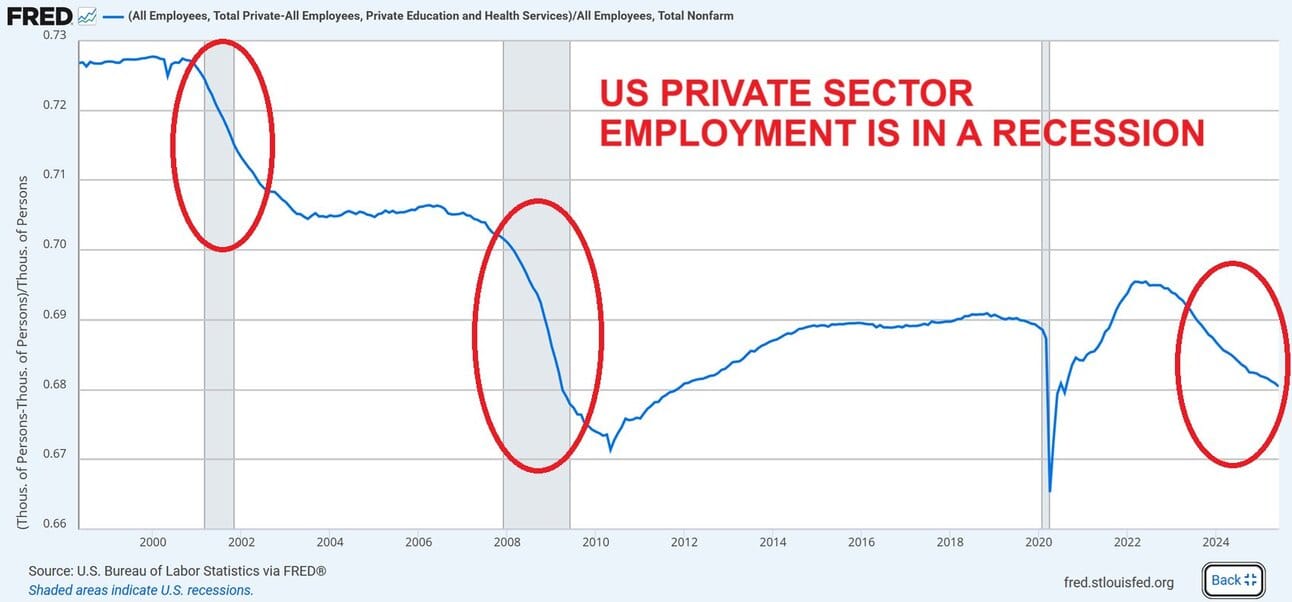
The labor market has been driven by the government and quasi-public roles over the last 3 years.
Private employment (excluding education and health services) share in US employment FELL to 68%, the lowest since the 2020 CRISIS.
Such trends usually occur in a recession.
In terms of monthly revisions, May was revised up by 5,000, the first upward revision since December 2024. However, the private sector saw a combined downward revision of 16,000 for April and May.
Since January 2024, nonfarm payrolls have been revised down by a total of 780,000, averaging -46,000 per month, according to Arkomina Research.
Since 2023, jobs have been revised downward in 23 of the past 30 months.

No need to add that these will also be revised down massively next year.
Let’s now breakdown the unemployment rate. The jobless rate fell from 4.24% to 4.12%, despite rising continuing claims. The number of people receiving unemployment benefits hit 1.964 million last week, the most in 4 years.

At the same time, the labor force participation rate dropped from 62.4% to 62.3%, meaning some unemployed people were reclassified as out of the workforce. Participation is now 0.5 points below its August–November 2023 peak and at its lowest since 2022.
A falling participation rate is typically a sign of a weakening, not strong, labor market.

If participation had held steady, unemployment would have risen to 4.3%.
Even at 4.1%, the jobless rate is 0.7 points above its cycle low. Such a rise has never occurred outside of a recession.
Meanwhile, the US foreign-born labor force has fallen 3.4% in the last 3 months, the biggest drop on record, outside of the 2020 crisis.

During this time, the foreign-born labor force has fallen by 1.1 million, to 32.6 million, the lowest since December 2024.

However, the foreign-born labor force has risen by 6.3 million, or +24% since 2020.
Meanwhile, the native-born labor force has grown by +1.8 million, or +1.3%, over the last 3 months, to a record 138.8 million.

According to the Brookings Institution and Stan Veuger of the American Enterprise Institute, US net immigration may hit zero or negative in 2025, reducing labor force growth. With fewer people entering the workforce, just 10,000–40,000 job creations a month may be enough to stabilize the unemployment rate at 4.1% in the second half of the year.
What is also concerning is the rise in youth unemployment, which sits near a decade high outside of the 2020 Crisis shocks.

Looking at other data, the job market picture does not look good as well.
Multiple jobholders hit 8.87 million in June, the 4th largest level in history. As a share of employment, it is in line with the Great Financial Crisis level.

In other words, millions of Americans are taking on extra jobs just to get by.
Additionally, the average weekly hours fell to 34.2, in line with the 2020 Crisis and the Great Financial Crisis levels.

To put this differently, employers are cutting hours signaling softening demand and uncertainty within the economy. The continuation of this trend will translate into even more job cuts, not just reduced hours.
Moreover, the number of Americans not in the labor force who currently want a job hit 6 million, the highest in 4 years.
This category includes people who are not officially part of the labor force, meaning they are not actively looking for work, but say they want a job. As a result, they are not counted in the official unemployment rate.
Since March 2023, the number of such individuals has increased by 1.9 million, or roughly 40%.

As a share of total employment, this figure reached about 4.0%, matching levels seen during the 2008 Financial Crisis. This means the unemployment rate might be understated.
All while temporary help services jobs fell to 2.5 million in June, the lowest since September 2020 and marking the 32nd consecutive month of year-over-year decline.

As a result of all of these, the Kansas City Fed Labor Market Conditions Index (LMCI), which combines 24 labor market indicators (like job gains, unemployment, wages, job openings, etc.), hit a new cycle low.

What is the most shocking about all these statistics is when we adjust the job numbers for the drop in the weekly hours and the Birth-Death model, then private sector jobs dropped ~400,000 in June, according to Rosenberg Research.
With the private sector shrinking, the US job market cannot be considered strong.
LEADING INDICATORS SIGNAL MORE WEAKNESS, SOME SUPPLEMENTAL DATA
The ISM Manufacturing Employment index fell to 45 points in June, marking its 5th straight monthly contraction.
Since mid-2022, there have been only a few times when the index crossed above 50 meaning the US manufacturing employment has been basically shrinking for the last 3 years.

Additionally, the ISM Services Employment index fell to 47 points in June, posting a 4th consecutive month of contraction.
We therefore, again, have both sectors' employment shrinking, suggesting more pain ahead for the labor market.

The outlook is not better when examining unemployment rate leading indicators.
The gap between US consumers saying jobs are “plentiful” and those saying they are “hard to get” fell to the lowest since 2017, excluding the 2020 Crisis.
It implies the unemployment rate could jump 1-2 percentage points in the next few months.

Interestingly, the share of small firms reporting poor sales as their most important problem jumped to the highest in 4 years, Renaissance Macro Research found. In the past, this has been a leading indicator for the US unemployment rate, as weak sales are usually a bellwether for layoffs.

As a reminder, small businesses employ 61.7 million people, or 46.4% of the private sector.
Before moving to Job openings and layoffs let’s also quickly review ADP employment data.
ADP processes paychecks for businesses nationwide and publishes monthly US jobs reports but excludes government employers.
The June report highlights a steep pullback in hiring, especially in small businesses. Firms under 50 employees shed 47,000 jobs, driving the overall private-sector decline of 33,000 jobs for the month, the most since March 2023. Additionally, the previous 3 months have been revised downward.
As a result, the 3-month average payroll growth fell to 19,000, the lowest since the 2020 Crisis.


Over the last 2 months, small firms shed 60,000 jobs, the most since the 2020 Crisis.

Overall, small companies have added just 5,300 jobs monthly on average in 2025. That’s a dramatic drop from last year’s 40,000-job monthly pace.
Last word about ADP, if you were wondering why there has been a gap between the ADP and non-farm payrolls, it is the education & health services sector. This industry has shed jobs since February, according to ADP, while BLS reported data show stable growth (until it is revised.

JOB OPENINGS AND LAYOFFS
US job openings jumped 374,000 in May, to 7.77 million, the highest since November 2024.
However, the 3-month average is 7.45 million, the third-lowest level in 4 years and below the 2018 high.

As a result, the ratio of job openings to unemployed rose to 1.07 from 1.03 in April, but remains below the 2018–2019 pre-pandemic average.

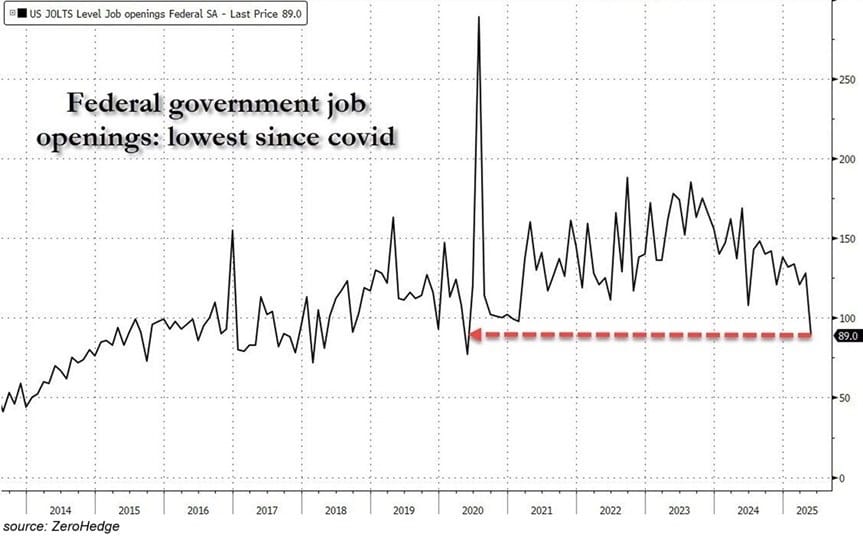
Notably, openings in the federal government dropped 39,000, to 89,000, the lowest since the 2020 Crisis.
Concerningly, US hiring remains at a recession level. The US hiring rate fell to 3.4% in May, the third-lowest since the 2020 Crisis.
The hiring rate is sitting below the 2001 recession levels and is in line with the Great Financial Crisis levels.

Meanwhile, forward-looking US job postings continue to decline. Job postings on Indeed dropped again in June to the lowest in 4 years. Obviously, this does not include the so-called ghost postings.

On the other hand, layoffs cooled somewhat but year-to-date remain at levels consistent with prior recessions.
US-based employers announced 47,999 job cuts in the last month, bringing the total Q2 2025 layoffs to 247,256, the highest Q2 total in 5 years, according to Challenger, Gray & Christmas data.
In the first 6 months of 2025, job cuts reached 744,308, the most for any 1st half of the year since the 2020 Crisis. This is also the 2nd-highest count since the Great Financial Crisis.

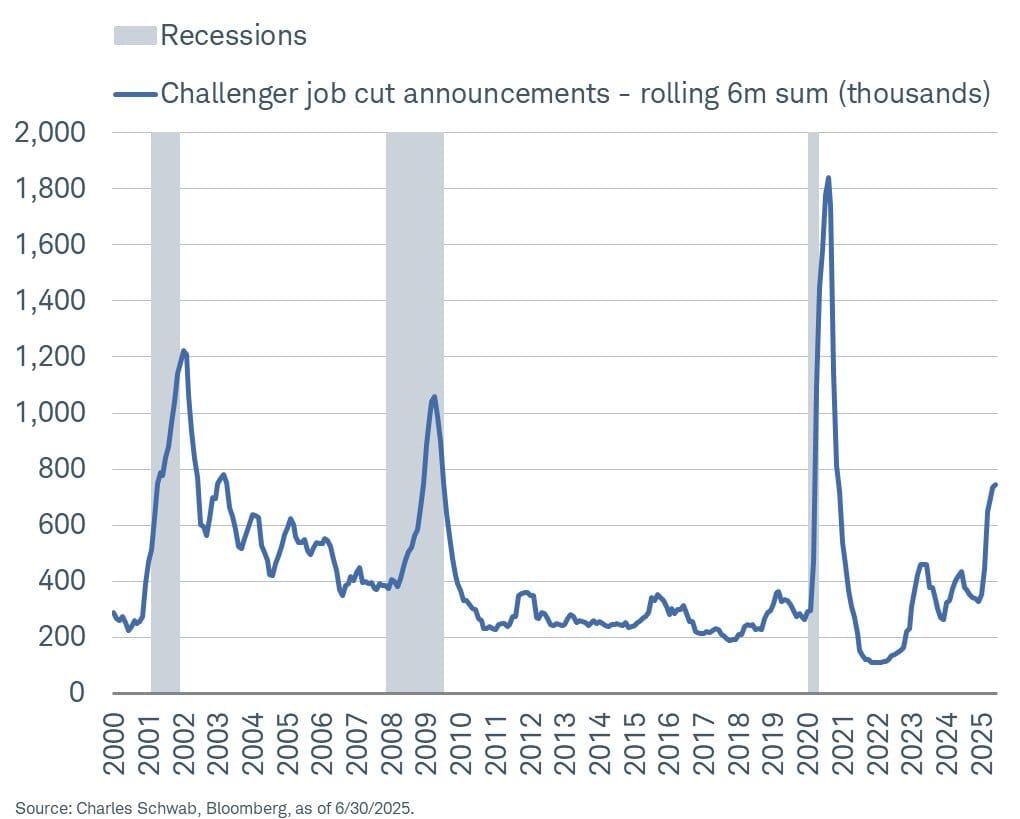
The government sector dominated job cuts with 288,628 layoffs, spanning federal agencies and contractors. Retail (79,865 cuts) and technology (76,214 cuts) ranked next in workforce reductions.

Economic pressures, business closures, and organizational restructuring fueled most of these cuts.
MacroEdge’s job cuts tracker confirmes the trend, reporting 85,900 layoffs in June.

SUMMARY
The June employment report paints a concerning picture of the U.S. labor market beneath seemingly stable headline numbers. While nonfarm payrolls showed a gain of 147,000 jobs, most of this growth came from government and healthcare hiring, with private sector job creation—excluding education and health—effectively flat. Once downward revisions are factored in, actual job growth may be near zero.
The broader trend points to a weakening labor market. Revisions from the Quarterly Census of Employment and Wages (QCEW) suggest that job growth over the past year has been overstated by nearly 800,000 jobs. Private employment as a share of total U.S. jobs has fallen to levels not seen since the 2020 crisis, while key indicators such as average weekly hours worked, youth unemployment, and multiple jobholders reflect mounting pressure on workers.
Labor force participation has declined, with many individuals leaving the workforce entirely. Despite a 4.1% unemployment rate, underemployment and discouraged workers signal deeper labor market strain. Moreover, leading indicators—from the ISM employment indices to falling job postings and rising small business pessimism—suggest further deterioration is likely.
Overall, the US job market appears increasingly fragile, propped up by public sector and healthcare hiring, while much of the private sector continues to weaken. The Federal Reserve is likely to maintain its wait-and-see approach on rate cuts in July as it waits for further clarity from inflation and ignores the weakness happening under the surface.


If you find it informative and helpful, you may consider a paid subscription (or annual if subscribed), become a Founding Member, and follow me on Twitter or Nostr:
Reply