- Global Markets Investor
- Posts
- Top 15 charts of the past weeks
Top 15 charts of the past weeks
A selection of the most interesting charts on markets, geopolitics, and the global economy
Global Markets Investor
April 17, 2026
In partnership with
GLOBAL MARKETS INVESTOR’S PORTFOLIO IS 🔥UP +93%🔥 SINCE JANUARY 2024
DURING THE MARCH-APRIL 2025 MARKET TURMOIL, MAJOR US INDEXES FELL NEARLY 20%, WHILE THE GMI PORTFOLIO GAINED OVER 5%, FIND OUT HOW BELOW:

Before the trading week concludes, let’s review some interesting data about financial markets.

Crash Expert: “This Looks Like 1929” → 71,048 Diversifying Here
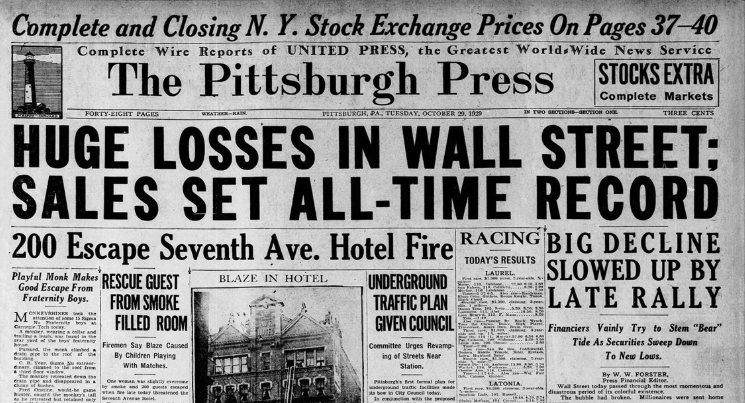
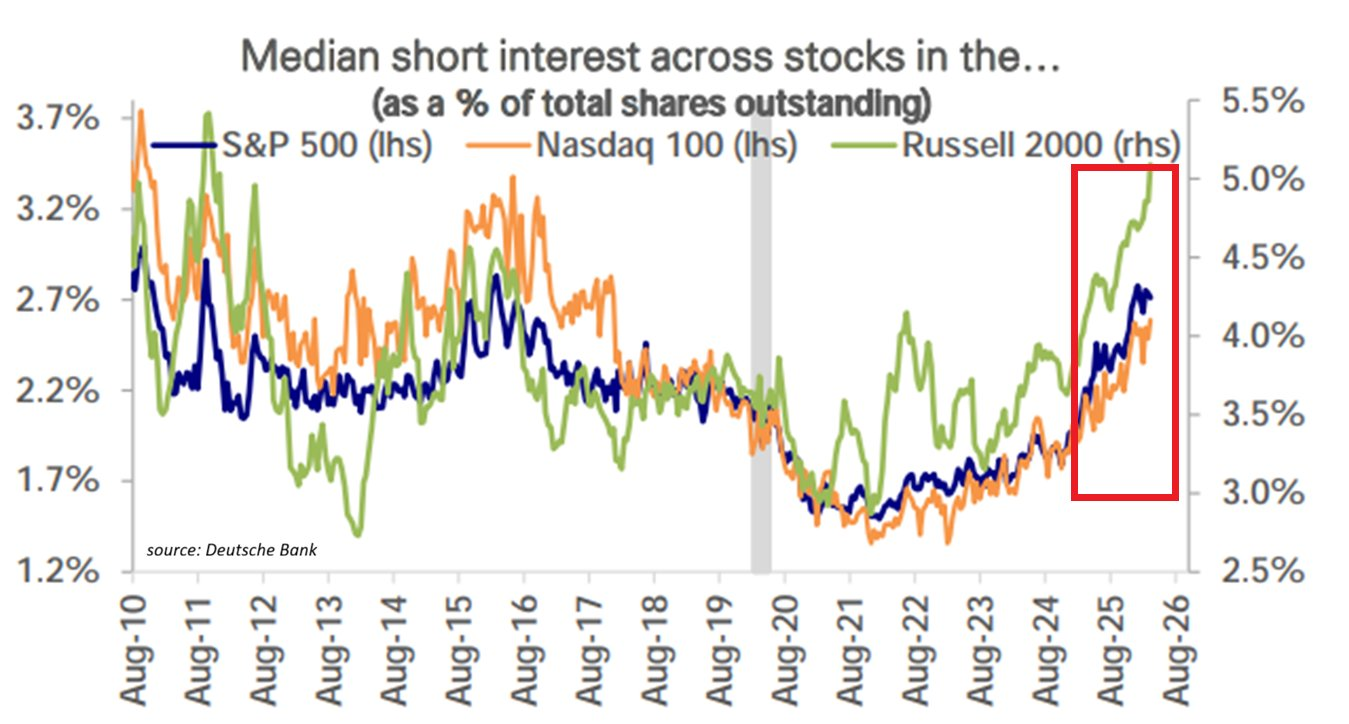
Mark Spitznagel, who made $1B in a single day during the 2015 flash crash, warned markets are mimicking 1929. Seems extreme but we did just see the worst quarter for the S&P since 2022.
So it’s not so surprising that Vanguard and Goldman Sachs forecasted 5% and 3% annual S&P returns respectively for 2024-2034.
Almost no one knows this, but postwar and contemporary art appreciated 10.2% annually with near-zero correlation to equities from 1995–2025 overall.*
And sure… billionaires like Bezos can make headlines at auction, but what about the rest of us?
Masterworks makes it possible to invest in legendary artworks by Banksy, Basquiat, Picasso, and more – without spending millions.
28 exits. Net annualized returns like 14.6%, 17.6%, and 17.8% on works held over 1 year+. $1.3 billion invested. 500+ offerings.*
Shares in new offerings can sell quickly but…
*According to Masterworks data. Past performance is not indicative of future returns. Investing involves risk. Important Reg A disclosures: masterworks.com/cd.
Reply