- Global Markets Investor
- Posts
- ⚠️This is one of the most expensive markets in history:
⚠️This is one of the most expensive markets in history:
The S&P 500 is overvalued on 19 of 20 selected metrics
Global Markets Investor
September 29, 2025
In partnership with
🔥🔥 GLOBAL MARKETS INVESTOR PORTFOLIO — UP 40% SINCE JANUARY 2024 DURING THE MARCH-APRIL 2025 MARKET TURMOIL, MAJOR US INDEXES FELL NEARLY 20%, WHILE THE GMI PORTFOLIO GAINED OVER 5%, FIND OUT HOW BELOW:

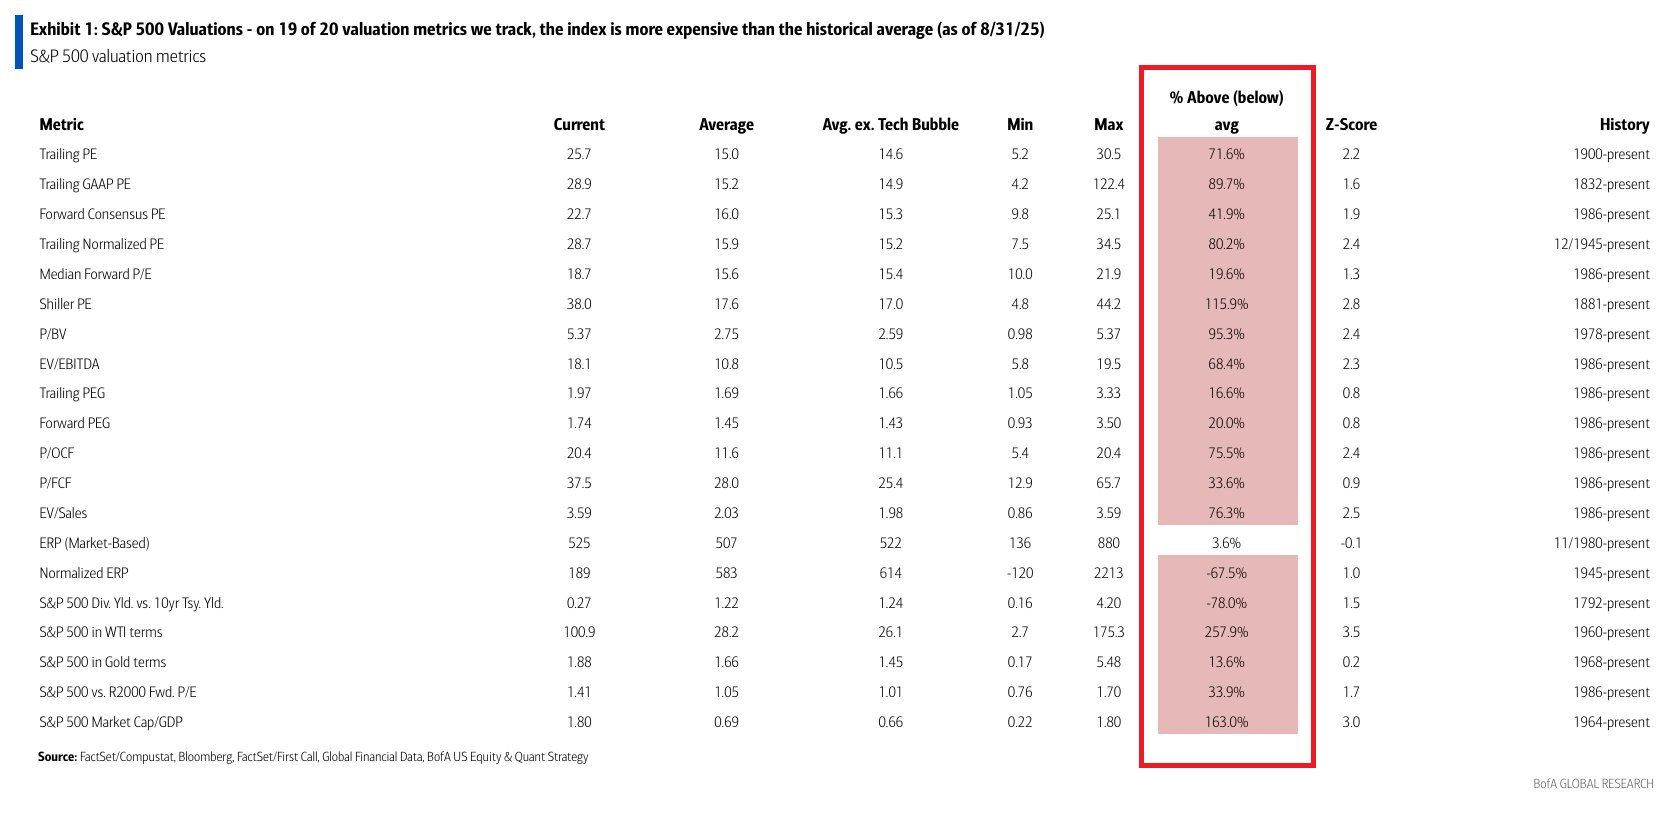
The S&P 500 is overvalued on 19 of 20 valuation metrics, according to BofA analysis. Some metrics go back as far as 1900, even though the index was created in 1957 (earlier years are likely estimates).

Join over 4 million Americans who start their day with 1440 – your daily digest for unbiased, fact-centric news. From politics to sports, we cover it all by analyzing over 100 sources. Our concise, 5-minute read lands in your inbox each morning at no cost. Experience news without the noise; let 1440 help you make up your own mind. Sign up now and invite your friends and family to be part of the informed.
The S&P 500 Market Cap/GDP is now 163% above its historical average.
For the Shiller P/E, the index is 116% above the average.
We have to remember that valuations are not precise timing tools, but history shows they are powerful predictors of long-term returns.
If you find it informative and helpful, consider a paid subscription or become a Founding Member, and follow me on Twitter or Nostr:
Reply