- Global Markets Investor
- Posts
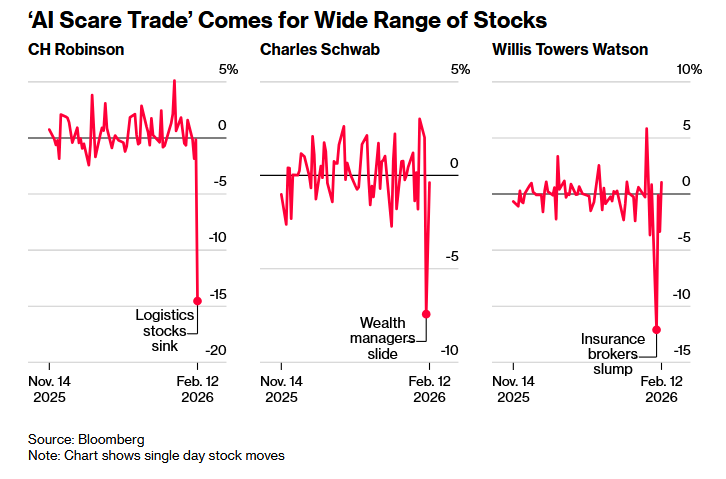
- ⚠️CHART OF THE WEEK: The US stock market is completely destroyed under the surface
⚠️CHART OF THE WEEK: The US stock market is completely destroyed under the surface
This has rarely occurred outside of the bear market
Global Markets Investor
February 14, 2026
In partnership with
GLOBAL MARKETS INVESTOR’S PORTFOLIO IS 🔥UP +93%🔥SINCE JANUARY 2024
DURING THE MARCH-APRIL 2025 MARKET TURMOIL, MAJOR US INDEXES FELL NEARLY 20%, WHILE THE GMI PORTFOLIO GAINED OVER 5%, FIND OUT HOW BELOW:

Over 115 S&P 500 stocks have experienced a decline of -7% or more in a single day over the last 8 trading sessions. Meanwhile, the S&P 500 is down just -2% from its all-time high.
Historically, when this many S&P 500 components have fallen -7% or more over an 8-day period, the average index drawdown has been -34%.
The last time this many stocks were hit while the index was still not far away from all-time highs was during the 2000 Dot-Com Bubble burst.

For context, during the 2008 Financial Crisis, this threshold was triggered when the index was already in a bear market.
Money Management Making You Mad?

Most business owners hit revenue goals and still feel cash-strapped.
Not because they're not making money. But because their money flow is broken, their decisions feel urgent instead of strategic, and their systems feel fragile instead of solid.
The Find Your Flow Assessment pinpoints exactly where friction shows up between your business and personal finances.
5 minutes with the Assessment gets you clarity on:
where cash leaks
what slows progress,
whether your current setup actually serves you
No spreadsheets, or pitch. Just actionable insight into what's not working and why.
Educational only. Not investment or tax advice.
As a result, the volatility of an average stock in the S&P 500 index spiked to ~11% over the last month, the highest level since the Great Financial Crisis. Over the same period, the index has been roughly flat.
In the past, such a divergence occurred only during periods of extreme market stress as shown below.

Higher single-stock volatility versus the S&P 500 has been observed only 1% of the time over the last 30 years.
Lastly, the put-call skew in the Nasdaq 100 ETF, $QQQ ( ▲ 1.91% ) , jumped to the highest since the April 2025 market crash.
The skew measures how much more investors are paying for downside protection using out-of-the-money puts versus upside exposure via calls.
The $QQQ skew is on par with the 2022 bear market, underscoring growing tech-sector anxiety.

All while the VIX index futures positioning is near the most bearish on record (hedge funds are short volatility).

Put simply, the US stock market is falling apart under the hood.
Is the market volatility set to rise even further?
If you find it informative and helpful, consider a paid subscription or become a Founding Member, and follow me on Twitter or Nostr:
Reply