- Global Markets Investor
- Posts
- ⚠️CHART OF THE WEEK: Is the US tech bubble bursting?
⚠️CHART OF THE WEEK: Is the US tech bubble bursting?
Technology stocks are experiencing historic underperformance
Global Markets Investor
March 07, 2026
In partnership with
GLOBAL MARKETS INVESTOR’S PORTFOLIO IS 🔥UP +97%🔥SINCE JANUARY 2024
DURING THE MARCH-APRIL 2025 MARKET TURMOIL, MAJOR US INDEXES FELL NEARLY 20%, WHILE THE GMI PORTFOLIO GAINED OVER 5%, FIND OUT HOW BELOW:

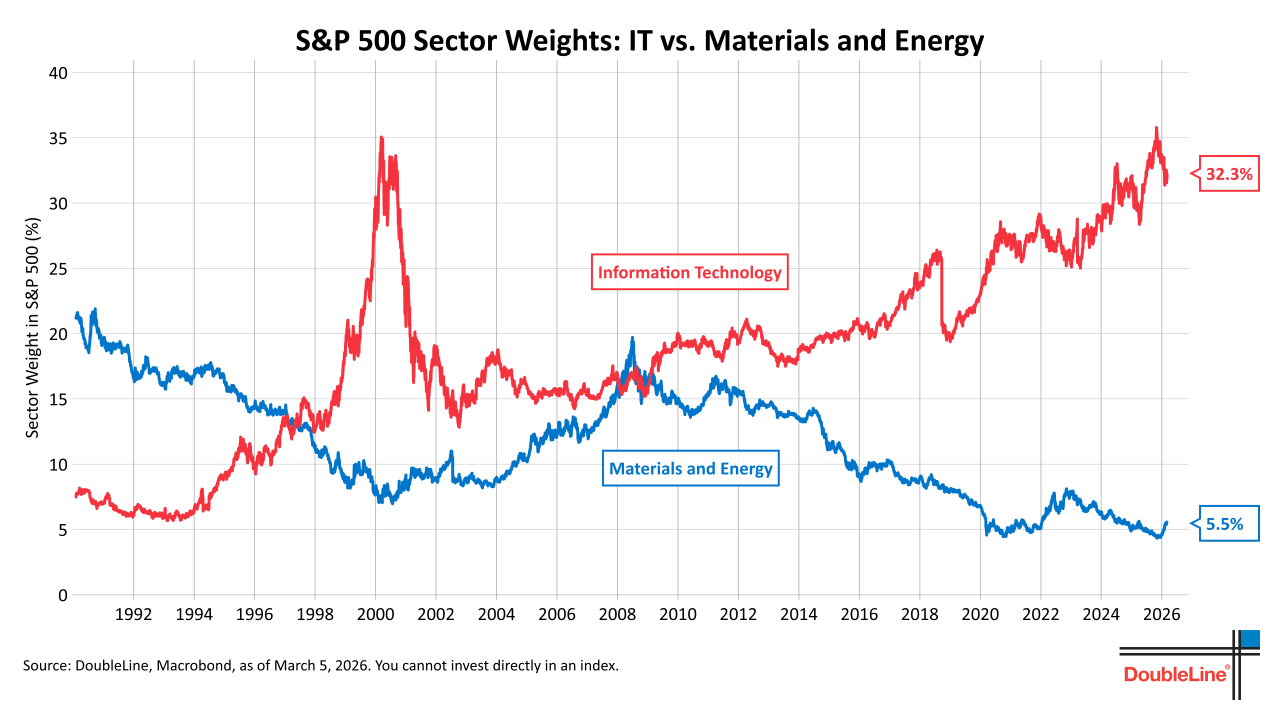
Information Technology makes up 32.3% of the S&P 500, down from a peak of ~35% just a few months ago.
By comparison, Materials and Energy combined represent 5.5% of the index, near the lowest on record. However, the weighting appears to be picking up.
When it all clicks.

Why does business news feel like it’s written for people who already get it?
Morning Brew changes that.
It’s a free newsletter that breaks down what’s going on in business, finance, and tech — clearly, quickly, and with enough personality to keep things interesting. The result? You don’t just skim headlines. You actually understand what’s going on.
Try it yourself and join over 4 million professionals reading daily.
As a result, the gap between the two is ~27 percentage points, near the widest in over 30 years. During the Dot-Com Bubble, IT sector peaked at ~35% before crashing to ~15% over the following 2 years.
Meanwhile, World tech equities are underperforming other stocks by ~7 percentage points, one of the worst starts to a year in history.

Tech relative performance is now tracking in the bottom 10% of years since 1973.
Historically, the median outcome by year-end has been +4 percentage points of outperformance for tech.
In fact, the last time tech underperformed this badly was during the 2000 Dot-Com Bubble.
Will the underperformance continue for years?
Full analysis regarding this topic can be found below.

If you find it informative and helpful, consider a paid subscription or become a Founding Member, and follow me on Twitter or Nostr:
Reply